mirror of
https://github.com/domainaware/parsedmarc.git
synced 2026-09-14 18:08:00 +00:00

 Sean WhalenandClaude Fable 5
62514bd72a
Sean WhalenandClaude Fable 5
62514bd72a
* Add per-domain DMARC compliance percentage to all aggregate dashboards (#112)

The from-domain volume table on every provider's aggregate dashboard is
now "Message volume and DMARC compliance by from domain" with columns
From Domain | Messages | % DMARC Compliant:

- OpenSearch Dashboards/Kibana: the agg-based data table is replaced by
  a TSVB table using a Filter Ratio metric (passed_dmarc:true over all,
  sum of message_count), pivoted on header_from.keyword. The time field
  is date_begin rather than the multi-valued date_range, which TSVB's
  per-value date histogram would double-count. Editing (not rendering)
  the panel on Kibana 8.x requires the metrics:allowStringIndices
  advanced setting.
- Grafana (Elasticsearch): a second passed_dmarc:true query joined by
  field with a binary calculation (Sum 2 / Sum 1) rendered as percentunit.
- Grafana (PostgreSQL): compliance column via an aggregate FILTER clause,
  COALESCEd so zero-pass domains show 0 instead of NULL.
- Splunk: sum(eval(if(passed_dmarc="true", message_count, 0))) inside
  stats, per the SPL eval-in-stats syntax.

All four providers were verified against the same seeded sample data in
the dashboard dev stack; each returns identical per-domain values
(example.com: 2425 messages, 5.3% compliant).

Dev stack fixes found along the way: cap Elasticsearch heap at 2g (the
unset heap auto-sized to 50% of host RAM and was OOM-killed with
bootstrap.memory_lock on large hosts), and install the elasticsearch
datasource plugin in Grafana, which is no longer bundled as of
Grafana 13.

Closes #112

Co-Authored-By: Claude Fable 5 <noreply@anthropic.com>

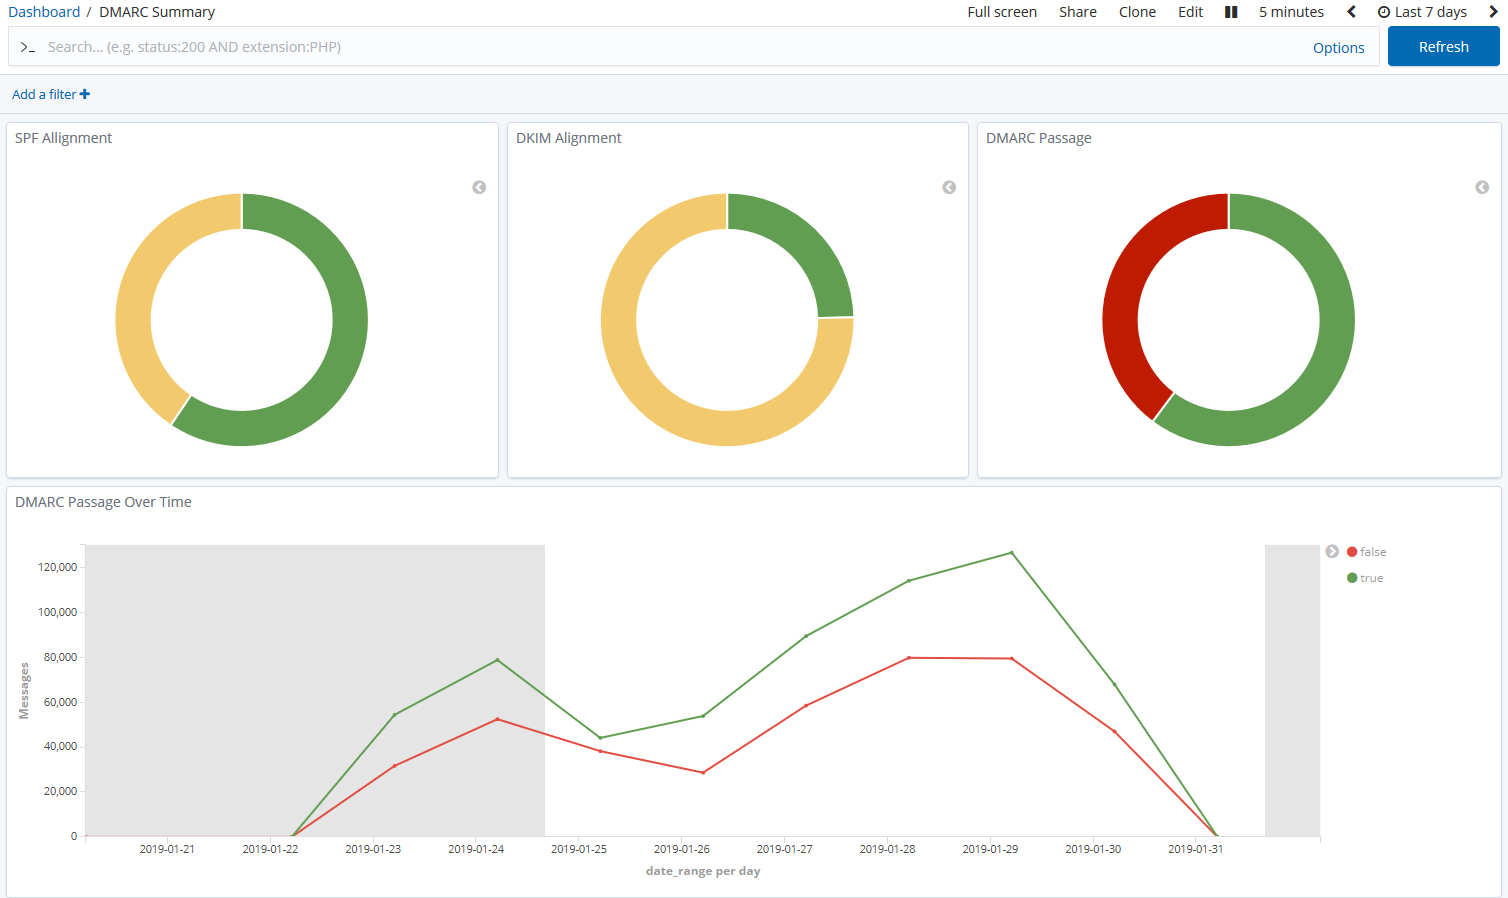
* Fix over-time charts double-counting reports via multi-valued date_range

date_range on ES/OpenSearch aggregate and SMTP TLS documents is a
two-element array [begin, end]. A date histogram buckets a document once
per value, so every over-time chart bucketing on date_range counted a
report twice whenever its begin and end dates fell in different buckets.
Range filtering on it was also wrong: a report spanning the whole window
matches neither endpoint.

Measured on the dev-stack sample data: a 1d histogram on date_range
returns doc_count 4592 / message sum 4724 against true totals of
2300 / 2427; the same histogram on date_begin returns exactly
2300 / 2427.

All date histograms (2 OSD/Kibana visualizations, 10 Grafana ES panels
including the summary pies) and all time-range filters (24 Grafana
target timeFields, the dmarc_aggregate* and smtp_tls* index-pattern
timeFieldName, the dev-stack dmarc-ag datasource) now use the
single-valued date_begin, matching the report-begin semantics of the
PostgreSQL (begin_date) and Splunk (_time = interval begin) dashboards.
Failure-report panels already used the single-valued arrival_date and
are unchanged.

Dev stack: installing the Elasticsearch datasource plugin via
GF_INSTALL_PLUGINS crash-loops Grafana >= 13 (the image ships a
root-owned plugins-bundled/elasticsearch remnant the background
installer cannot replace), so the bootstrap script now installs it via
grafana cli and restarts Grafana instead.

Co-Authored-By: Claude Fable 5 <noreply@anthropic.com>

* Address Copilot review comments on PR #834

- kibana.md: "filter on our filter out" -> "filter on or filter out".
- OSD/Kibana export: fix "filed  DMARC" -> "failed DMARC" and the
  backticked `ruf ` trailing space in the RUF explainer panel, and
  rename the "SMPT TLS failure details" visualization to "SMTP TLS
  failure details" (object title and visState).
- dashboard-dev-bootstrap.sh: reuse wait_for() after the Grafana
  plugin-install restart so a hang fails with a clear timeout message
  instead of an opaque downstream curl error.

The ndjson changes were round-tripped through the dev-stack OSD
(import -> re-export from the global tenant) and re-import cleanly into
both OSD and Kibana 8.19.

Co-Authored-By: Claude Fable 5 <noreply@anthropic.com>

* AGENTS.md: reviews must cover prose and hunk context, not just function

Codifies the lessons from the PR #834 Copilot review: whole-file
canonical dashboard exports put pre-existing titles/markdown in the
diff, so they get a text-level pass; proofread the full hunk around
prose edits, not only changed lines; and mid-incident glue code gets
the same review bar (and helper-reuse check) as planned code.

Co-Authored-By: Claude Fable 5 <noreply@anthropic.com>

* Address second round of Copilot review comments

- CHANGELOG.md: rename the premature "10.2.5" heading to "Unreleased",
  matching the repo convention where the release commit assigns the
  version number (see 855d267 for 10.2.4).
- docker-compose.yml: make the dev-stack Elasticsearch heap overridable
  via ES_JAVA_OPTS in .env (default unchanged at 2g), using the compose
  file's existing ${VAR:-default} idiom, for smaller machines.

Co-Authored-By: Claude Fable 5 <noreply@anthropic.com>

---------

Co-authored-by: Claude Fable 5 <noreply@anthropic.com>
parsedmarc




parsedmarc is a Python module and CLI utility for parsing DMARC
reports. When used with Elasticsearch and Kibana (or Splunk), it works
as a self-hosted open-source alternative to commercial DMARC report
processing services such as Agari Brand Protection, Dmarcian, OnDMARC,
ProofPoint Email Fraud Defense, and Valimail.
Note
Domain-based Message Authentication, Reporting, and Conformance (DMARC) is an email authentication protocol.
Sponsors
This project is maintained by one developer. Please consider sponsoring my work if you or your organization benefit from it.
Features
- Parses aggregate/rua DMARC reports: the legacy draft and 1.0 schemas (RFC 7489) and the new RFC 9990 schema for the final DMARC standard (RFC 9989)
- Parses failure/ruf DMARC reports (RFC 6591 and RFC 9991; formerly called forensic reports)
- Parses reports from SMTP TLS Reporting (TLS-RPT, RFC 8460)
- Can parse reports from an inbox over IMAP, Microsoft Graph, or Gmail API
- Transparently handles gzip or zip compressed reports
- Consistent data structures
- Simple JSON and/or CSV output
- Optionally email the results
- Optionally send the results to Elasticsearch, OpenSearch, Splunk, or PostgreSQL, for use with premade dashboards
- Optionally send the results to Apache Kafka, Amazon S3, Azure Log Analytics (Microsoft Sentinel), a Graylog (GELF) endpoint, a syslog server, or an HTTP webhook
Python Compatibility
This project supports the following Python versions, which are either actively maintained or are the default versions for RHEL or Debian.
| Version | Supported | Reason |
|---|---|---|
| < 3.6 | ❌ | End of Life (EOL) |
| 3.6 | ❌ | Used in RHEL 8, but not supported by project dependencies |
| 3.7 | ❌ | End of Life (EOL) |
| 3.8 | ❌ | End of Life (EOL) |
| 3.9 | ❌ | Used in Debian 11 and RHEL 9, but not supported by project dependencies |
| 3.10 | ✅ | Actively maintained |
| 3.11 | ✅ | Actively maintained; supported until June 2028 (Debian 12) |
| 3.12 | ✅ | Actively maintained; supported until May 2035 (RHEL 10) |
| 3.13 | ✅ | Actively maintained; supported until June 2030 (Debian 13) |
| 3.14 | ✅ | Supported (requires imapclient>=3.1.0) |