mirror of
https://github.com/nlohmann/json.git
synced 2026-10-29 00:55:44 +00:00

31 lines
3.2 KiB
XML
31 lines
3.2 KiB
XML


<svg class="nj-fig nj-charts nj-charts--sizes" viewBox="0 0 340 220" role="img" aria-labelledby="nj-charts-bs-canada nj-charts-bs-canada-d" xmlns="http://www.w3.org/2000/svg">
|
|
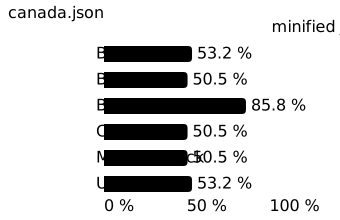
<title id="nj-charts-bs-canada">Size of canada.json in each binary format relative to minified J​SON</title>
|
|
<desc id="nj-charts-bs-canada-d">B​JData 53.2 %; B​ON8 50.5 %; B​SON 85.8 %; C​BOR 50.5 %; MessagePack 50.5 %; U​BJSON 53.2 %. Smallest: B​ON8 and C​BOR and MessagePack.</desc>
|
|
<text class="nj-charts-panel" x="8" y="18">canada.json</text>
|
|
<line class="nj-charts-grid" x1="104" y1="40" x2="104" y2="196"/>
|
|
<text class="nj-charts-tick" x="104" y="211">0 %</text>
|
|
<line class="nj-charts-grid" x1="186.727" y1="40" x2="186.727" y2="196"/>
|
|
<text class="nj-charts-tick" x="186.727" y="211">50 %</text>
|
|
<text class="nj-charts-rowlabel nj-charts-fmt" x="96" y="58.5">B​JData</text>
|
|
<path class="nj-charts-c1 nj-charts-dim" d="M104 46 H188.022 Q192.022 46 192.022 50 V58 Q192.022 62 188.022 62 H104 Z"><title>canada.json, B​JData: 53.2 % of minified J​SON</title></path>
|
|
<text class="nj-charts-rowlabel nj-charts-fmt nj-charts-best" x="96" y="84.5">B​ON8</text>
|
|
<path class="nj-charts-c2" d="M104 72 H183.555 Q187.555 72 187.555 76 V84 Q187.555 88 183.555 88 H104 Z"><title>canada.json, B​ON8: 50.5 % of minified J​SON (smallest)</title></path>
|
|
<text class="nj-charts-rowlabel nj-charts-fmt" x="96" y="110.5">B​SON</text>
|
|
<path class="nj-charts-c3 nj-charts-dim" d="M104 98 H241.96 Q245.96 98 245.96 102 V110 Q245.96 114 241.96 114 H104 Z"><title>canada.json, B​SON: 85.8 % of minified J​SON</title></path>
|
|
<text class="nj-charts-rowlabel nj-charts-fmt nj-charts-best" x="96" y="136.5">C​BOR</text>
|
|
<path class="nj-charts-c4" d="M104 124 H183.555 Q187.555 124 187.555 128 V136 Q187.555 140 183.555 140 H104 Z"><title>canada.json, C​BOR: 50.5 % of minified J​SON (smallest)</title></path>
|
|
<text class="nj-charts-rowlabel nj-charts-fmt nj-charts-best" x="96" y="162.5">MessagePack</text>
|
|
<path class="nj-charts-c5" d="M104 150 H183.555 Q187.555 150 187.555 154 V162 Q187.555 166 183.555 166 H104 Z"><title>canada.json, MessagePack: 50.5 % of minified J​SON (smallest)</title></path>
|
|
<text class="nj-charts-rowlabel nj-charts-fmt" x="96" y="188.5">U​BJSON</text>
|
|
<path class="nj-charts-c6 nj-charts-dim" d="M104 176 H188.022 Q192.022 176 192.022 180 V188 Q192.022 192 188.022 192 H104 Z"><title>canada.json, U​BJSON: 53.2 % of minified J​SON</title></path>
|
|
<line class="nj-charts-ref" x1="269.455" y1="36" x2="269.455" y2="196"/>
|
|
<text class="nj-charts-tick nj-charts-tick--r" x="271.455" y="32">minified J​SON = 100 %</text>
|
|
<text class="nj-charts-tick" x="269.455" y="211">100 %</text>
|
|
<text class="nj-charts-val" x="197.022" y="58.5">53.2 %</text>
|
|
<text class="nj-charts-val nj-charts-best" x="192.555" y="84.5">50.5 %</text>
|
|
<text class="nj-charts-val" x="250.96" y="110.5">85.8 %</text>
|
|
<text class="nj-charts-val nj-charts-best" x="192.555" y="136.5">50.5 %</text>
|
|
<text class="nj-charts-val nj-charts-best" x="192.555" y="162.5">50.5 %</text>
|
|
<text class="nj-charts-val" x="197.022" y="188.5">53.2 %</text>
|
|
</svg>
|